Analytics
Everything the Results page shows you — completion rates, drop-off, device and field breakdowns, filtering, editing, and CSV export.
Results overview#
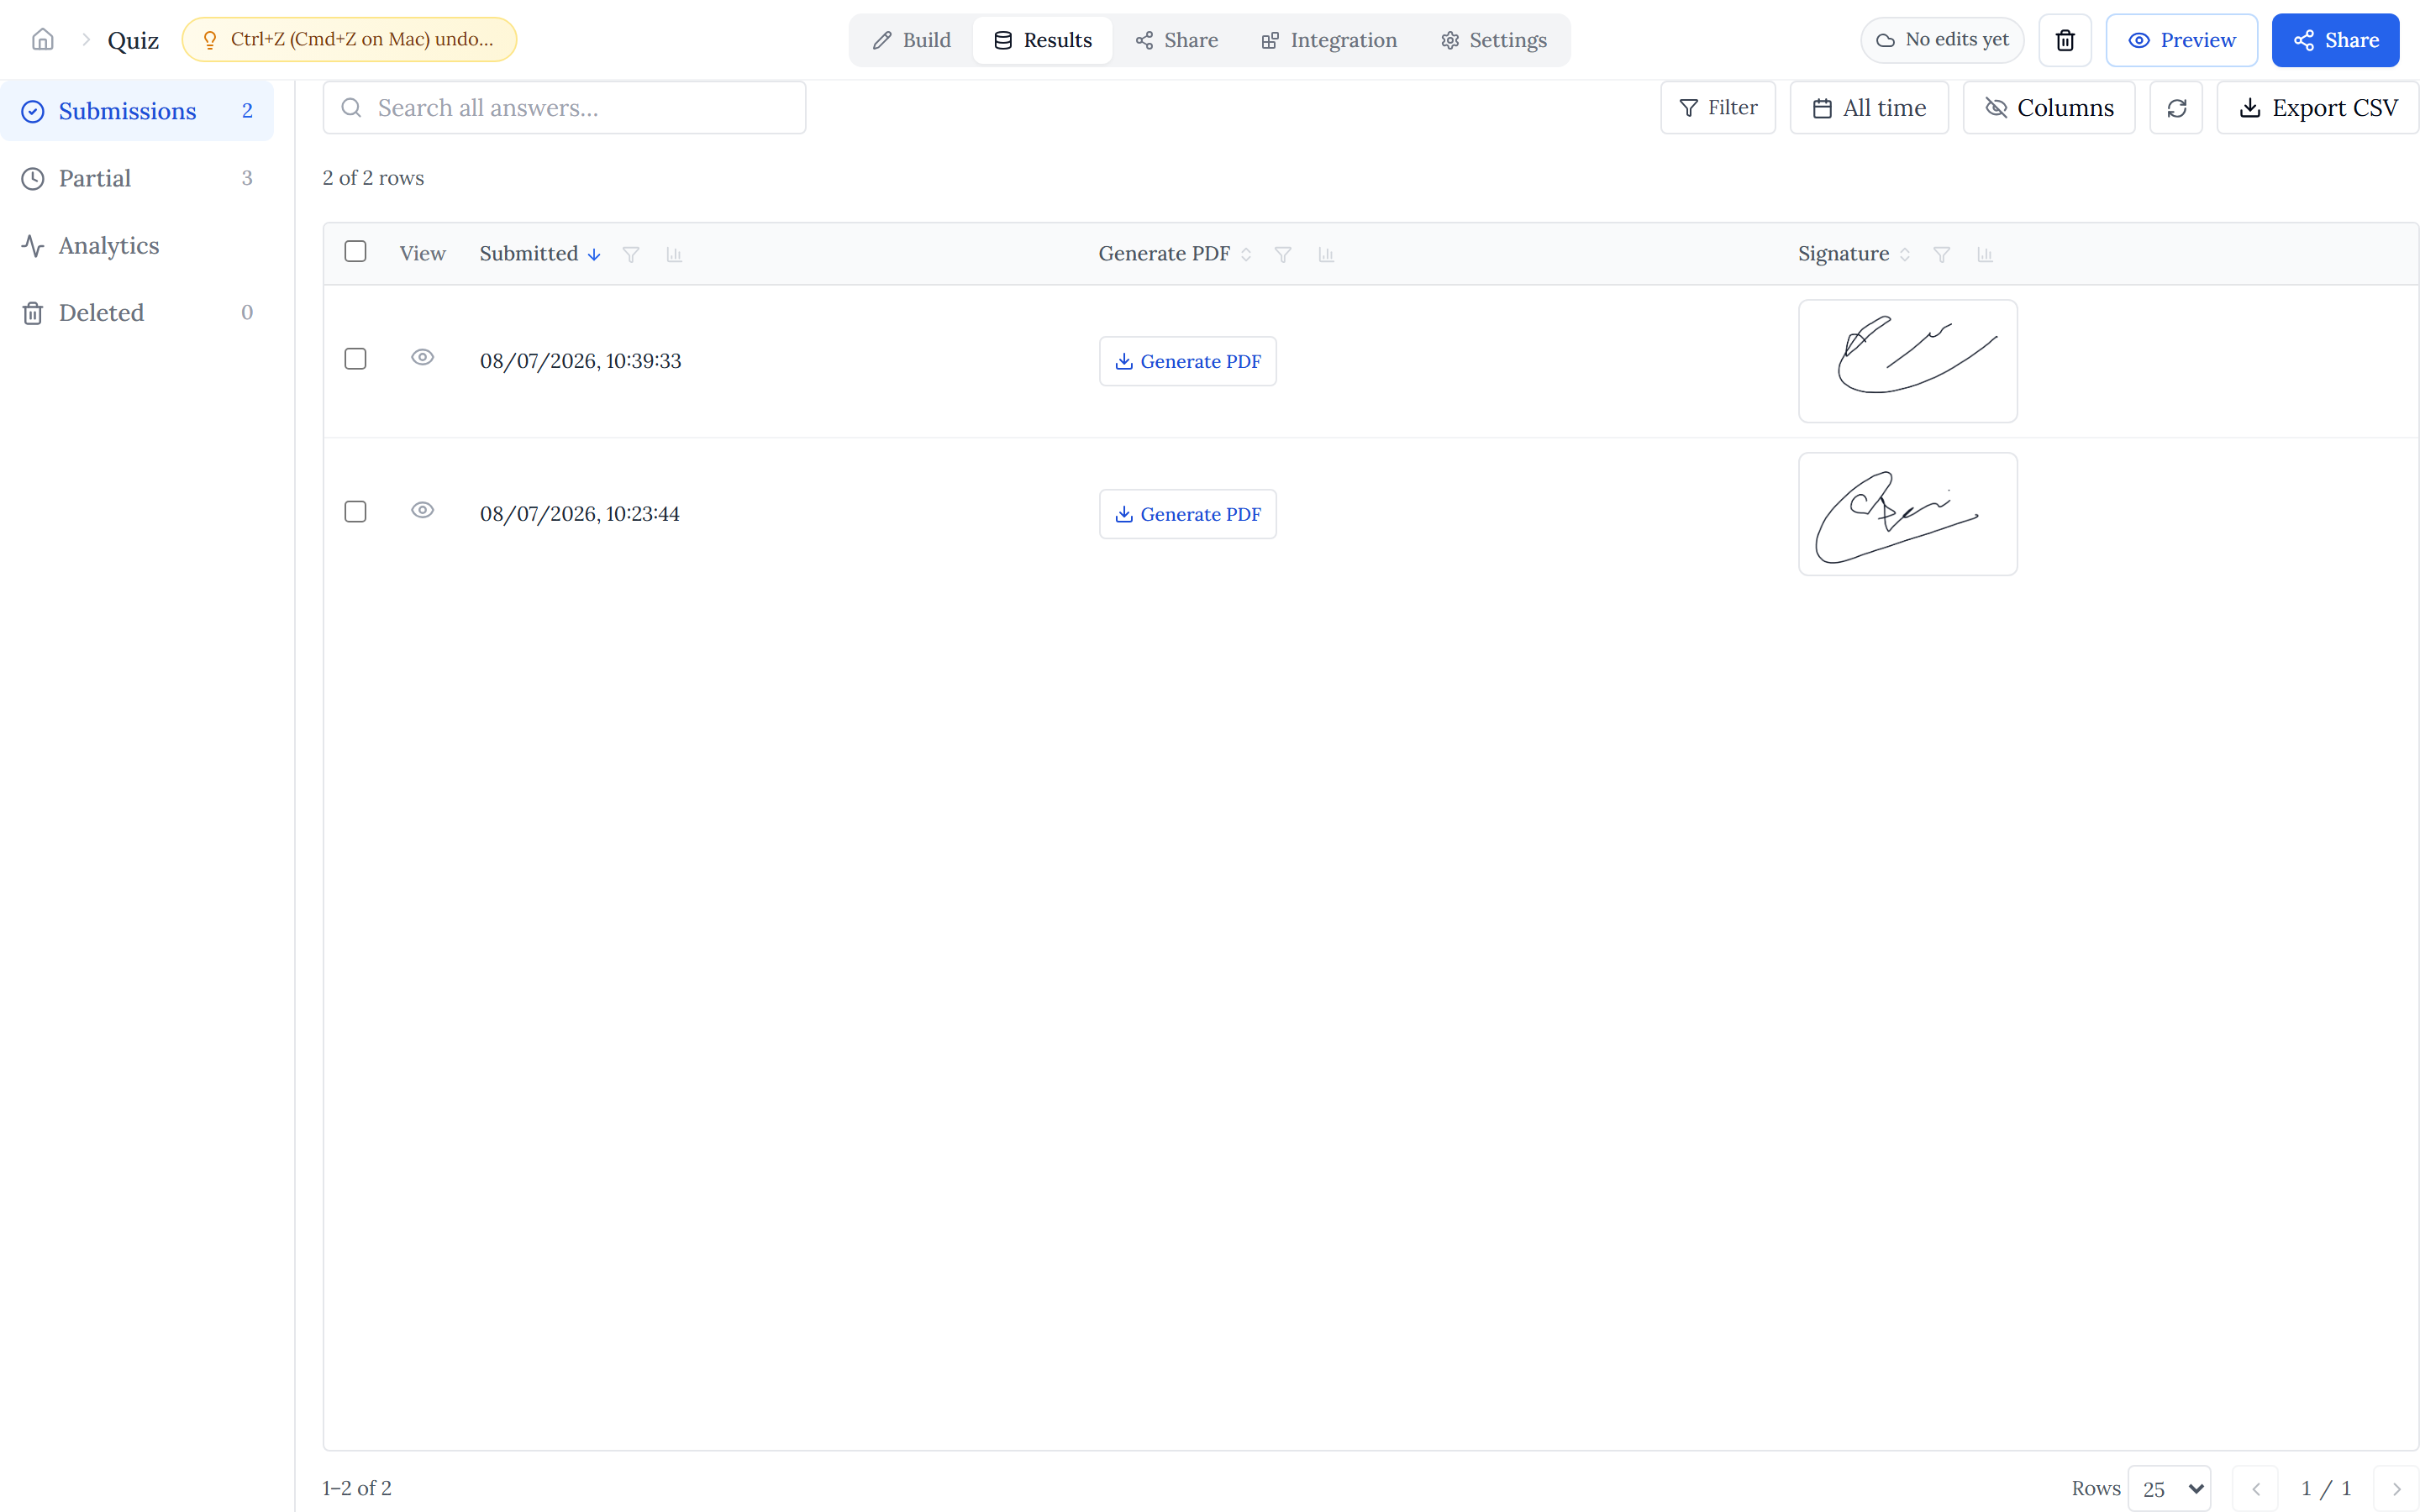
Open a form's Results page to see far more than a table of answers. The top navigation splits responses into Submissions (completed), Partial (started but not finished), Analytics, and Deleted — each with a live count so you can read totals at a glance.
The counts tell the headline story: how many people completed the form versus how many only started, which together give your overall completion rate.
Form analytics#
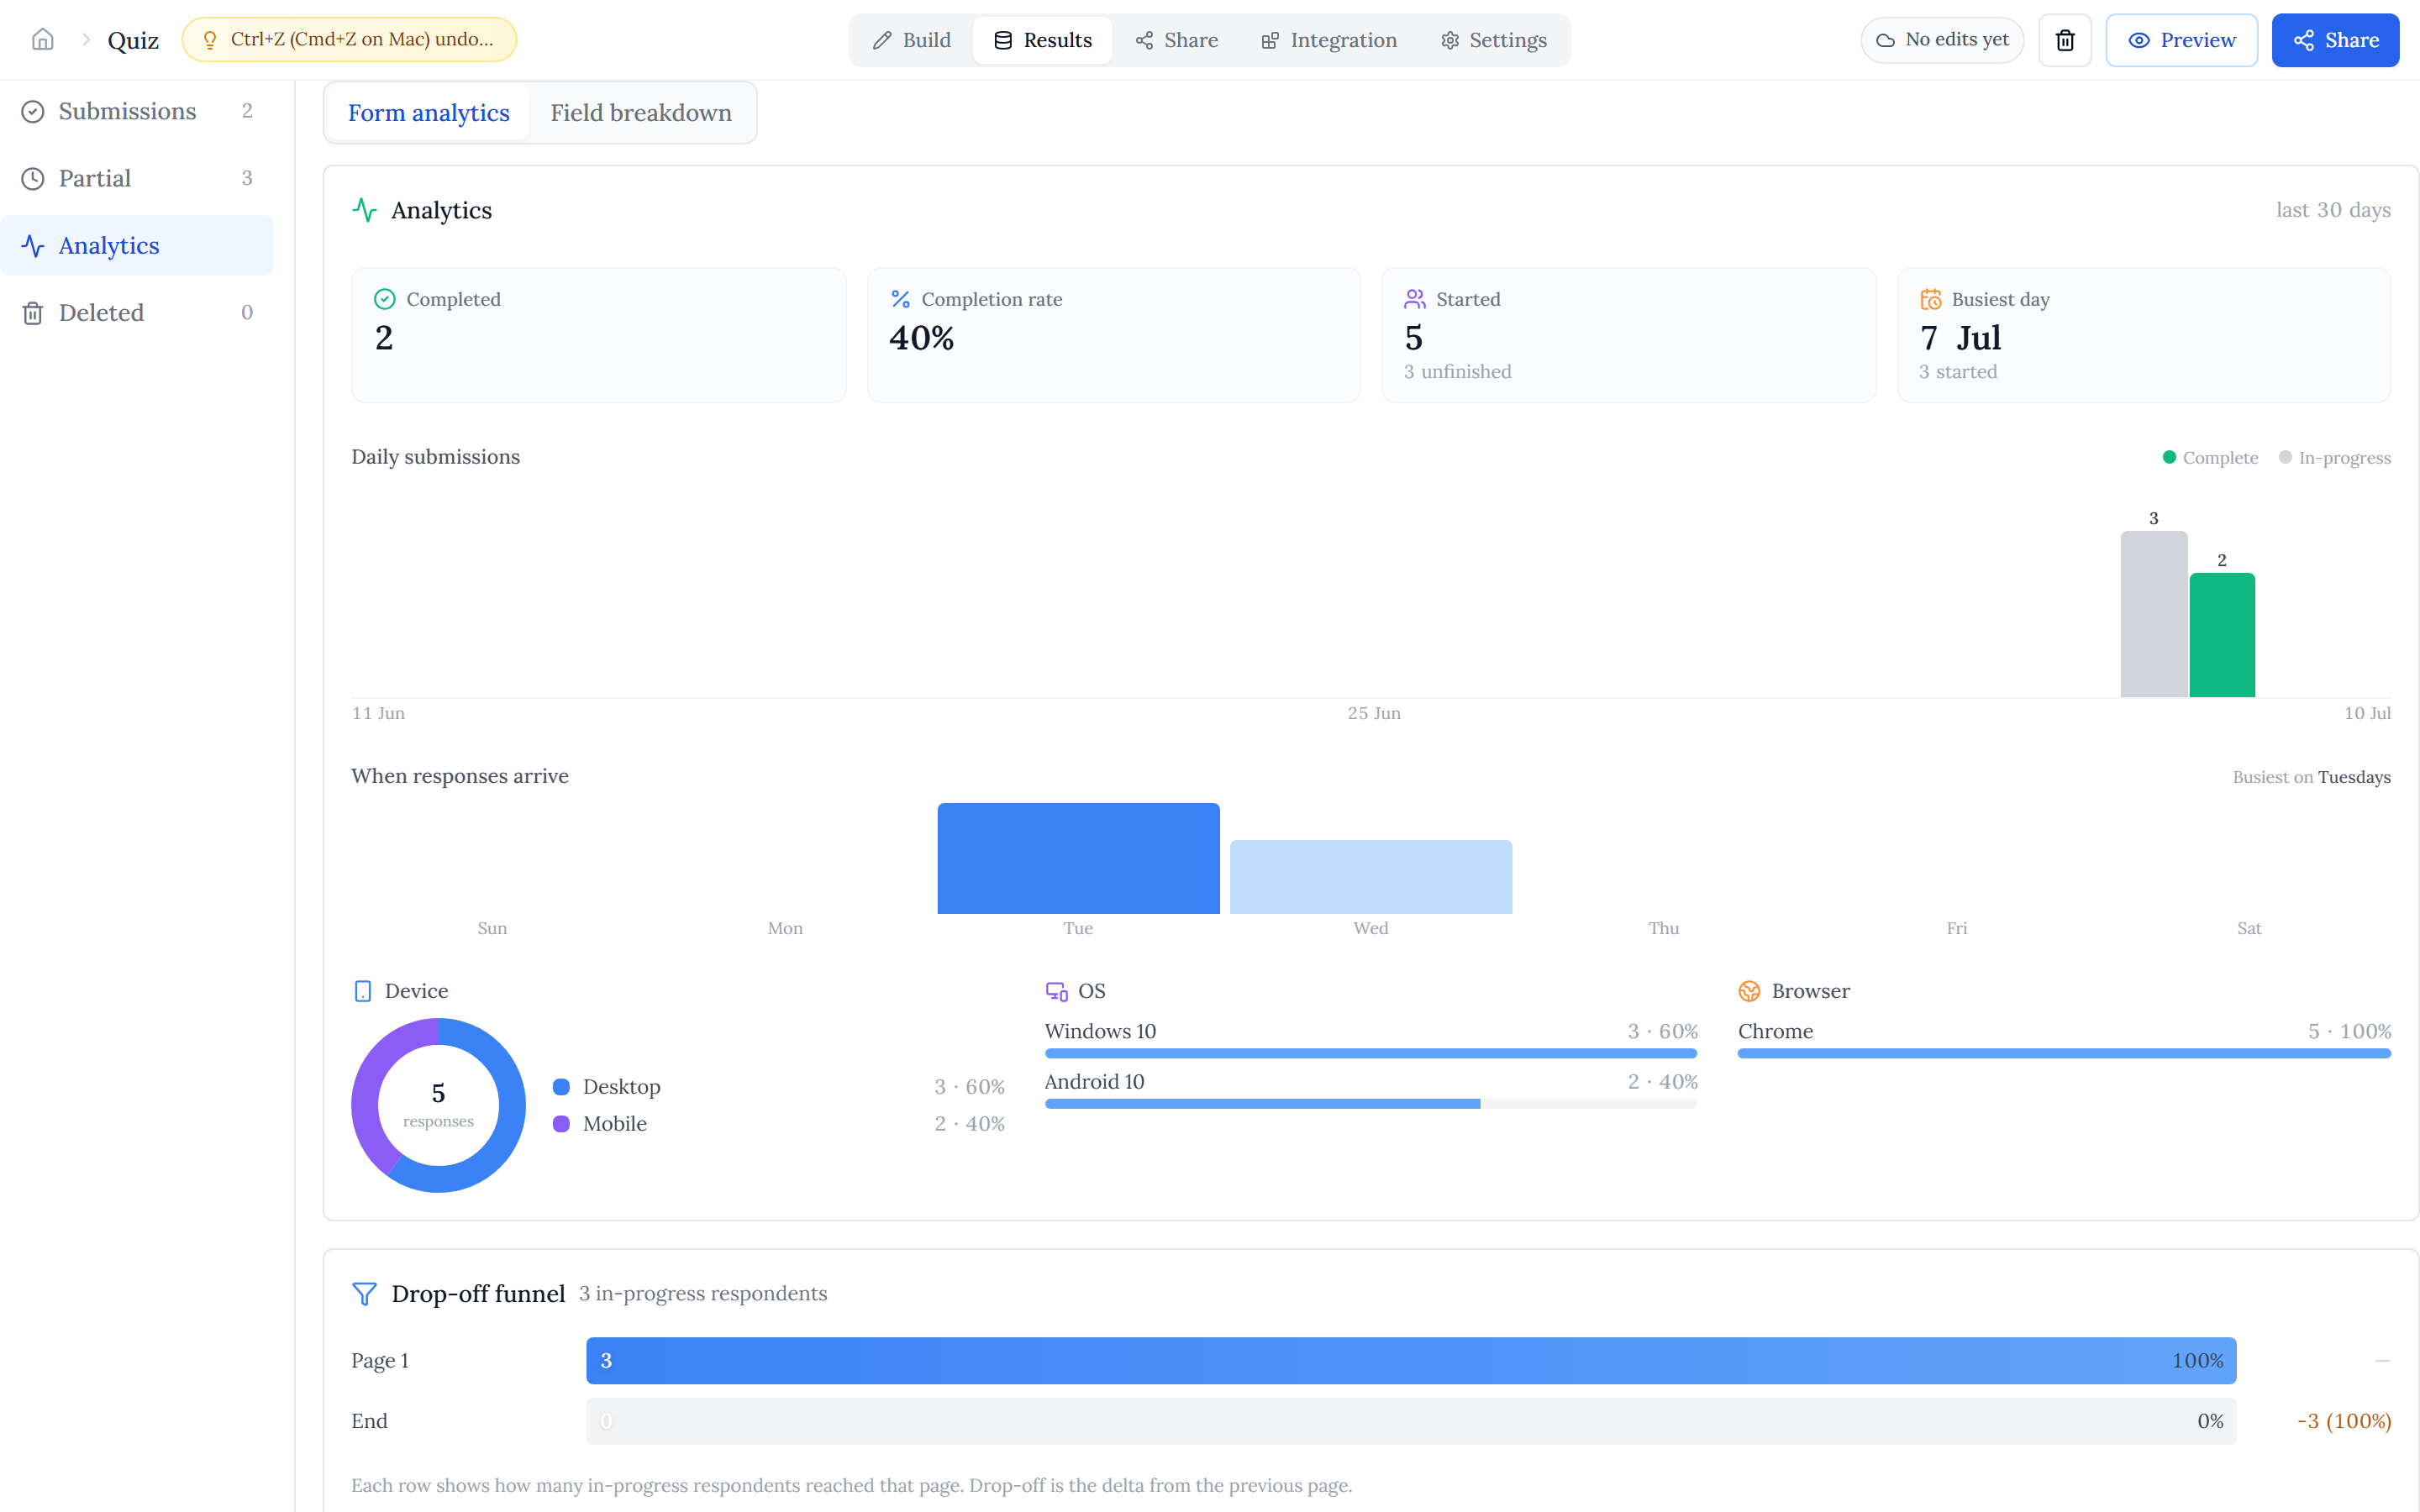
The Analytics view opens on "Form analytics", a dashboard covering the last 30 days:
- KPI row — Completed, Completion rate, Started, and busiest day, each with a momentum comparison to the prior period.
- Completion trend — a stacked started-vs-completed chart over time, so you can tie response spikes to a campaign or share.
- Arrival pattern — which days of the week responses cluster on, so you know when to send reminders.
- Audience — device breakdown, plus OS and browser bars, showing whether respondents are mostly on mobile or desktop.
Drop-off funnel#
The funnel shows how many people reached each page of your form, so you can see exactly where respondents abandon. A big drop on one page is a signal to shorten it or rework a confusing question.
Field breakdown#
Switch to the "Field breakdown" tab for a per-question view — one card per field, with a distribution matched to the field type:
- Number, currency, rating, and scale — a histogram with min, median, max, and average.
- Single and multi choice — a top-value bar chart; yes/no shows a donut.
- Date and date & time — a 30-day heatmap.
- Text, email, phone, and similar — the most frequent answers.
Filter & sort#
The data table has a toolbar for narrowing down responses. Search across answers, or use advanced filters to match on a field's value, submission status, or date range. Click a column header to sort, and use the columns menu to hide or show fields — hidden columns are also excluded from export.
Edit answers#
Open any submission to see its full detail, and edit answers on the fields that support it — handy for fixing a typo or completing a record. Edits are tracked, and the results table flags cells that were changed after submission.
Export to CSV#
Export downloads a CSV built from exactly what you're looking at — your active filter and current sort are honoured, and hidden columns are left out. Composite fields (like Address or Choice Matrix) fan out into one column each, and the file opens cleanly in Excel, Google Sheets, or Numbers.